Beyond the Google Analytics Dashboard: Real-Time Analytics and AI on Your Customer Data
Google Analytics Realtime offers a useful pulse, but only through a limited set of metrics and dimensions. Learn how Dataverses turns deeper analytics data into flexible live dashboards and LLM-powered answers.
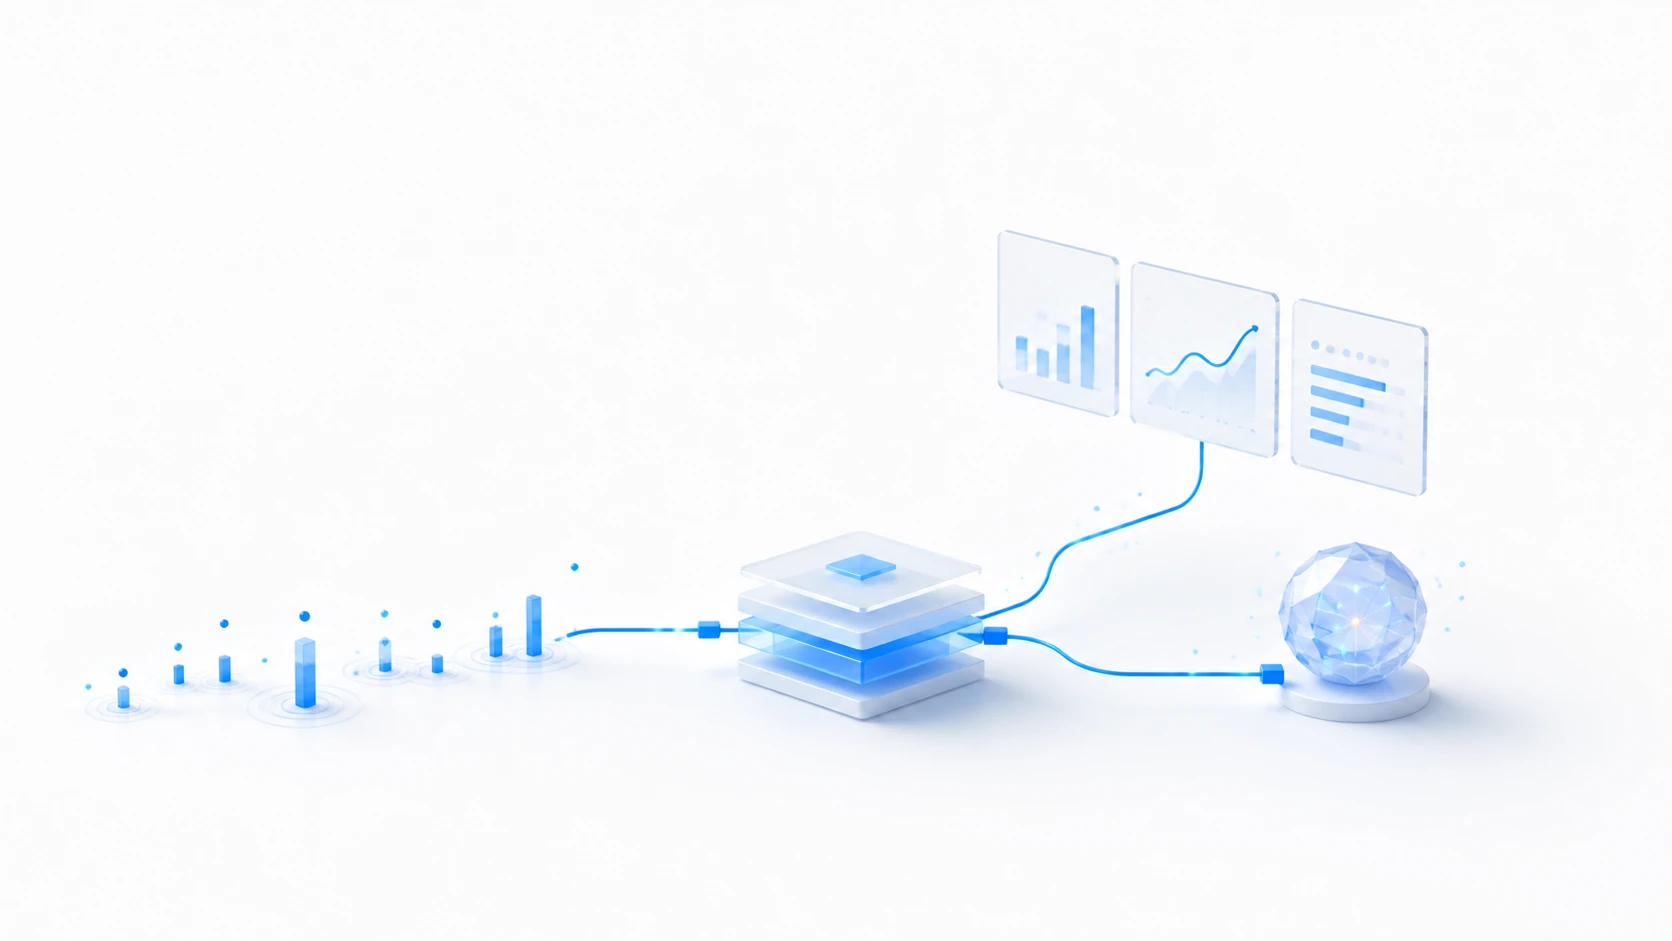
The Google Analytics Realtime report is useful for seeing that something is happening. It is rarely enough to explain why it is happening, where the change began, or what deserves attention next.
A campaign goes live at 9:00 a.m. Traffic climbs. Product views jump. The marketing team sees activity in Google Analytics, but the questions that matter arrive immediately:
- Are visitors adding products to carts, or only browsing?
- Which campaign and landing page are driving the change?
- Where are visitors leaving the funnel?
- Is one device category or region behaving differently?
- Is the change real, or did event tracking break?
The Realtime report can provide a quick pulse. It cannot provide every metric, dimension, event parameter, or level of detail collected by Google Analytics. Its dashboard is designed for immediate monitoring, not open-ended investigation.
That is why Dataverses includes a Google Analytics connector. It brings the available analytics data into a managed platform where teams can design their own metrics, preserve detail and history, build dashboards around real decisions, and ask questions through an LLM grounded in a governed dataset.
The result is not another copy of the Google Analytics dashboard. It is a flexible analytics product built around the questions your team actually asks.
How Google Analytics Delivers Metrics
Google Analytics begins with events. A website or app sends events such as page_view, view_item, add_to_cart, sign_up, or purchase, together with parameters that describe the interaction. Google then processes those events and delivers them through several different surfaces.
flowchart TB
    Events["Collected events and parameters"] --> Process["Google Analytics processing"]
    Process --> Realtime["Realtime report and API · recent pulse"]
    Process --> Reports["Standard reports and Data API · processed metrics"]
    Process --> Export["BigQuery export · event-level detail"]
    Realtime --> Platform["Dataverses analytics model"]
    Reports --> Platform
    Export --> Platform
    Platform --> Delivery["Custom dashboards · alerts · SQL · Seraphis AI"]
These delivery paths are not interchangeable.
- Realtime reporting prioritizes speed and a compact monitoring experience.
- Standard reports and the Data API return processed, aggregated reporting data similar to the Google Analytics interface.
- BigQuery export provides raw event and user-level data without all the additional processing applied to standard reports.
Google notes that the Data API accesses the same reporting data as the Analytics interface, including its reporting-identity settings. By contrast, BigQuery export contains raw event and user-level data and excludes some of the value additions used in standard reports. Numbers can therefore differ even when they originate from the same property.
Understanding this distinction is essential. A dashboard metric is not simply a raw event count with a nicer label. Processing, identity, attribution, thresholds, modeling, and query dimensions can all affect the result.
Why the Realtime Report Is Not Enough
Google Analytics Realtime is designed to answer a narrow question: What activity is happening on my website or app right now?
The official Realtime report documentation lists a focused set of cards:
- Active users during the last 5 and 30 minutes.
- Acquisition information for recently processed users.
- Views by page title or screen name.
- Event counts and key events by event name.
- A limited set of audience and user-property breakdowns.
That is useful for confirming that a campaign is sending traffic or that measurement code is producing events. But the interface is fixed around those cards. It does not become a fully customizable live dashboard simply because the underlying property collects more event parameters.
There are practical constraints:
- Realtime cards display at most 700 rows, and high-cardinality data can be grouped into an
(other)row. - User-acquisition processing is limited, so new or unprocessed users may not have complete first-source information.
- Attribution analysis is deliberately limited to keep the report responsive.
- App events may be delayed because mobile data can be batched.
- The report focuses on a recent 30-minute window rather than a flexible analytical history.
The Realtime Data API offers more control over presentation, but not unlimited analytical freedom. According to the official Realtime dimensions and metrics schema, its general metrics are activeUsers, eventCount, keyEvents, and screenPageViews. It supports a defined set of dimensions, but event-scoped custom dimensions and event-scoped custom metrics are not supported.
The API is programmable, but its capability is still bounded by that schema. It can rearrange the available building blocks; it cannot expose every collected event parameter at the most detailed granularity.
A Pulse Is Different from an Investigation
Consider the difference:
| Realtime can quickly show… | A deeper investigation may need… |
|---|---|
| Active users in the last 30 minutes | Event sequences for individual sessions or pseudonymous users |
| Event count by event name | The parameters attached to each event occurrence |
| Views by page or screen | Landing page, campaign, device, content, and funnel-step combinations |
| Key events by name | Which path preceded the key event and where similar users dropped out |
| A compact acquisition view | More complete attribution context and comparison with processed history |
These are not merely requests for more rows. They require dimensions, parameters, history, and granularity that the fixed Realtime surface does not provide.
Where the Detailed Granularity Lives
For event-level analysis, Google Analytics can continuously populate an events_intraday_YYYYMMDD table through BigQuery streaming export. The official export schema includes one row per event together with nested fields for event parameters, user properties, device context, geography, traffic-source context, application information, and item data.
That is much closer to the original analytical grain than a dashboard card. It makes it possible to model custom funnels, retain selected parameters, inspect sequences, and create dimensions that match the organization rather than a predefined report layout.
Streaming export is still not perfect. Google describes it as a best-effort service that makes current-day data available within minutes but may contain gaps because of late events or failed uploads. New-user and new-session traffic-source fields are also excluded from the streaming export. Google recommends querying the daily events_YYYYMMDD table for a more stable dataset; daily tables can still receive late updates after they are created.
A credible architecture therefore uses three analytical layers:
- Pulse: Realtime reporting for quick monitoring with a fixed, limited schema.
- Processed analysis: Standard reports or the Data API for Google Analytics-style metrics and historical comparisons.
- Event detail: Streaming and daily exports for finer-grained modeling when that export is configured.
Dataverses can organize the selected delivery paths into one governed data product. Every dataset should expose its source, granularity, freshness, and processing status so users know whether they are looking at a recent signal, a processed report metric, or raw exported events.
From Google Analytics Events to a Live Customer Analytics Product
flowchart TB
    GA["Google Analytics reporting and event data"] --> Connect["Dataverses managed connector"]
    Connect --> Lakehouse["Governed metrics and event models"]
    Lakehouse --> Live["Live dashboards and alerts"]
    Lakehouse --> AI["Seraphis AI and natural-language analysis"]
    Lakehouse --> Final["More complete daily reporting"]
The architecture is deliberately simple from the user's point of view. Dataverses manages the movement and preparation of data; your team focuses on definitions, decisions, and outcomes.
1. Connect Google Analytics Without Building Another Export Pipeline
The Google Analytics connector brings selected analytics data into Dataverses on a managed schedule. Depending on the configured access path and required level of detail, the data product can use processed reporting metrics, exported events, or both.
The ingestion layer preserves source timestamps, load timestamps, and the state of each synchronization. It also handles recurring work such as incremental loading, retries, schema changes, and historical backfills. This matters because a live dashboard is only trustworthy when users can see how current its underlying data is.
One maintained connection replaces repeated CSV exports, fragile reporting scripts, and manual extracts for every new question.
2. Turn Events into Business Definitions
When event-level export is configured, raw Google Analytics data offers far more flexibility than the Realtime report. Flexibility alone, however, does not create a trusted metric. A useful model has to define the funnel explicitly.
For a conversion funnel, that might mean:
product_view_rate = users_with_view_item / active_users

add_to_cart_rate = users_with_add_to_cart / users_with_view_item

checkout_rate = users_with_begin_checkout / users_with_add_to_cart

key_event_rate = sessions_with_key_event / total_sessions
Each measure is built from analytics events, but the event names, eligible users or sessions, attribution settings, and reporting window still need to be explicit.
Dataverses can organize custom events, parameters, content groups, campaign fields, and item-level activity into stable analytical datasets. That opens questions that are awkward to answer in a fixed report, such as which landing-page and device combinations produce strong engagement but weak progression to the next funnel step.
Identity still requires care. User-ID, device identifiers, consent choices, Google Signals, and modeled data can affect what is visible and how users are counted. A governed model should preserve privacy controls and make those limitations clear instead of presenting every count as an exact census.
3. Analyze Changes as the Source Makes Them Available
Once recent data is modeled, the platform can serve operational views designed for action:
- A campaign cockpit comparing active users, engagement, funnel events, and key events.
- A funnel monitor that flags a sudden drop between product view and checkout.
- A content view that surfaces pages attracting attention but failing to drive the next action.
- An anomaly feed for unusual traffic, conversion, revenue, or event-tracking behavior.
- A technical-quality view that compares devices, browsers, regions, and app or web streams.
This is where “real time” becomes useful. The objective is not to refresh every chart as fast as possible. It is to reduce the time between a meaningful change and a business response.
If a landing page receives a traffic spike but its add-to-cart rate collapses, marketing and analytics teams can investigate while the campaign is still running. If one browser suddenly stops producing a key event, they can inspect the implementation before the next daily report.
Add an LLM Without Giving Up Governance
Dashboards are effective when users already know which chart to open. An LLM helps when the next question is exploratory, combines several Google Analytics dimensions, or needs a plain-language explanation.
With Dataverses, Seraphis AI can operate over the governed Google Analytics model rather than pointing blindly at a swamp of raw events. That distinction is essential.
The LLM should know:
- Which metric definition is approved.
- Which dimensions can be combined safely.
- Whether the data is recent, processed, or still subject to late updates.
- Which tables and rows the current user may access.
- Which attribution rule and reporting window apply to the answer.
- When an answer is an observation and when it is an inference.
Users can then ask questions such as:
Which landing pages have high traffic but a low add-to-cart rate in the last 30 minutes?
Which campaigns increased engaged sessions today without increasing key events?
Which product pages are trending in Google Analytics, and where does their funnel drop off?
Compare this week's conversion rate by device category and summarize the largest changes.
Explain today's funnel anomaly and show the metrics behind your conclusion.
Seraphis can translate the question into queries against authorized data, return the supporting numbers, and summarize the result. It can shorten the path from “something changed” to “here is what changed, where to look, and what evidence supports it.”
It should not be treated as an oracle. A good AI analytics experience keeps metric definitions visible, links answers to source data, communicates freshness, and lets an analyst inspect the underlying result.
Four High-Value Use Cases
Live Campaign Monitoring
Watch acquisition source, landing-page engagement, funnel activity, and key events together. The team can distinguish a traffic spike from a meaningful engagement spike while there is still time to adjust spend or creative.
Funnel and Tracking Diagnostics
A sudden fall in add_to_cart, begin_checkout, or purchase events may represent a real customer problem—or a broken tracking implementation. Comparing adjacent funnel events, devices, browsers, regions, and event parameters helps identify where the change begins.
Content and Audience Insights
Recent page views, engagement, scrolls, searches, and funnel events show which content is attracting attention and which audiences are responding. Dataverses can model those signals into reusable views instead of requiring a new exploration for every campaign review.
AI-Assisted Daily Briefings
Instead of manually assembling screenshots, a team can ask Seraphis to summarize the previous day, call out unusual changes, and separate provisional observations from more complete processed performance. The briefing can preserve links to the relevant dashboard or query for review.
What This Architecture Does Not Pretend to Solve
A credible customer analytics product makes its boundaries explicit.
- Realtime Google Analytics data is provisional. It can arrive late, change during processing, or differ from later processed reports.
- Streaming export is best effort. Google does not provide a completeness service-level agreement for it.
- Google Analytics is not an accounting ledger. Purchase and revenue events reflect the tracking and processing rules configured for the property.
- Attribution is a model, not an observed law. State the attribution window and rules used by every metric.
- Cross-device identity is not automatic. Use consented first-party identifiers and appropriate privacy controls.
- An LLM does not repair undefined metrics. Semantic definitions, access controls, data quality, and freshness metadata have to come first.
These limits do not reduce the value of the architecture. They make its outputs easier to trust.
Start with One Decision That Needs to Be Faster
The best first Google Analytics data product is not a warehouse containing every possible event. It is a focused model for one recurring decision.
Choose a campaign, funnel, or product group. Connect the Google Analytics property, define a small set of metrics, set a useful freshness target, and decide which views use recent signals versus more complete processed data. Then publish the result through a dashboard and give the team a governed natural-language interface for follow-up questions.
This follows the same principle described in our guide to lightweight data architecture for SMEs: start with one trusted data product and add complexity when a real constraint demands it.
Bring Google Analytics into Dataverses
Google Analytics should not remain trapped in fixed reports, manual exports, and isolated event tables.
With the Dataverses Google Analytics connector, you can incorporate behavioral data into a governed lakehouse, serve recent signals through live analytics, build more complete historical reporting, and let Seraphis AI answer questions across the trusted analytics model.
You keep the speed of recent Google Analytics signals while gaining the history, consistent definitions, and conversational access that turn those signals into decisions.
👉 Talk to Dataverses about building a real-time, AI-ready customer analytics product.
Tags
Keep up with us
Get the latest updates on data engineering and AI delivered to your inbox.
Contents in this story
Recommended for you

SME vs. Enterprise Data Architecture: Why You May Not Need Databricks to Build a Great Lakehouse
Aug 24, 2026 · 11 min read
DuckDB on Apache Iceberg: Why It Is Fast, Where It Shines, and Where It Does Not
Aug 2, 2026 · 11 min read
Announcing Apache Spark 4.2.0: Geospatial Intelligence, First-Class CDC, DSv2 Transactions, and Arrow-Powered PySpark
Jul 27, 2026 · 6 min read