Unlocking Real-Time Insights: A Beginner's Guide to Apache Kafka in Dataverses

Why Kafka? And Why Is It So Hard?
Apache Kafka has become the de facto standard for real-time event streaming. Whether you're processing financial transactions, tracking user clickstreams, or syncing microservices, Kafka sits at the center of modern data architectures. LinkedIn originally built it to handle 1.4 trillion messages per day — and today, over 80% of Fortune 100 companies rely on it.
But here's the uncomfortable truth: running Kafka in production is painful.
Not because Kafka itself is poorly designed — it's exceptional at what it does. The pain comes from everything around it: the infrastructure provisioning, configuration tuning, monitoring, scaling, and the constant operational toil that turns your data engineers into full-time Kafka babysitters.
The Real Pain of Managing Kafka Clusters
If you've ever operated Kafka at scale, these scenarios will feel familiar:
1. Cluster Provisioning Is a Multi-Day Affair
Standing up a production Kafka cluster isn't a one-click operation. You need to:
- Provision broker nodes with the right instance types and disk configurations.
- Configure network topology — VPCs, security groups, load balancers.
- Set up replication factors, partition counts, and retention policies per topic.
- Deploy monitoring agents (Prometheus, Grafana, JMX exporters).
- Harden security — TLS certificates, SASL authentication, ACLs.
What should take minutes often takes days or weeks, depending on your team's familiarity and your organization's change management process.
2. ZooKeeper: The Legacy Bottleneck
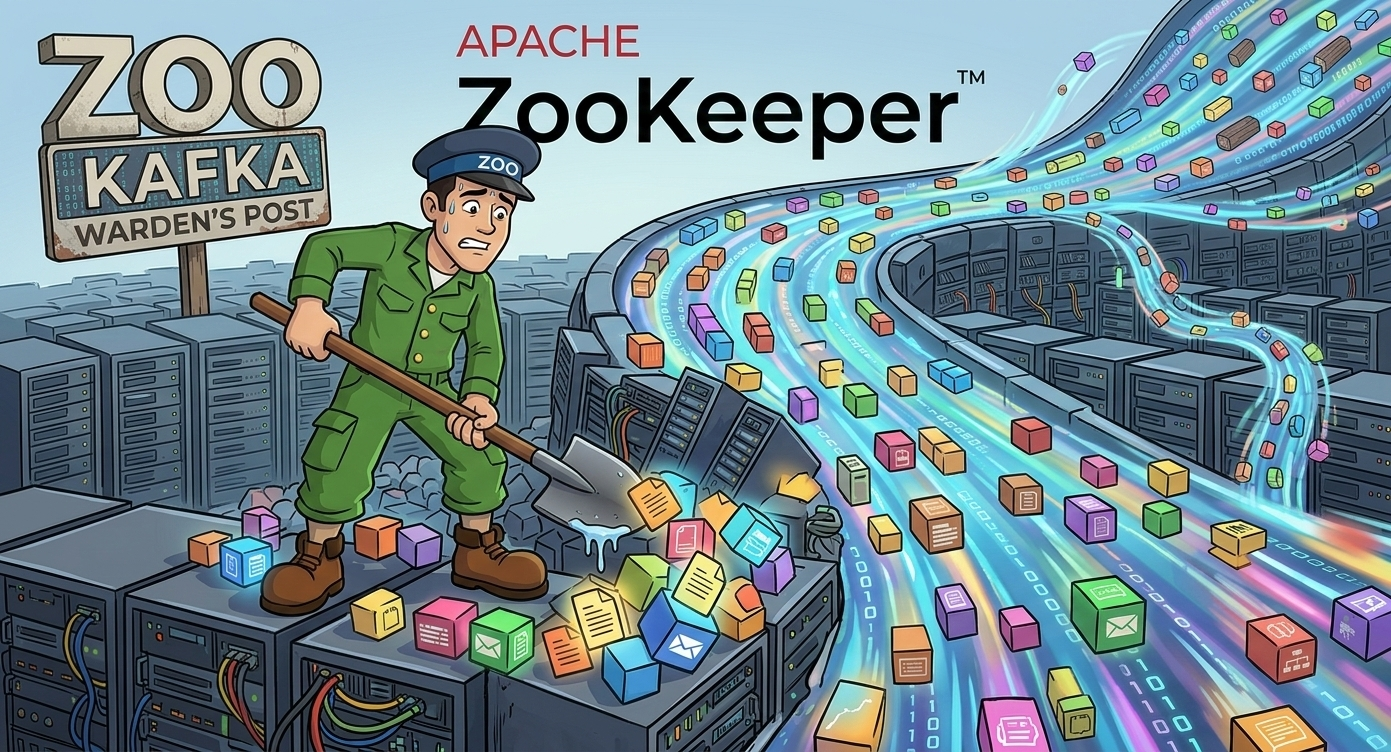
Traditionally, Kafka depended on Apache Zookeeper for cluster metadata management — tracking which brokers are alive, which partitions live where, and who the controller is. This created a painful operational dependency:
- Two systems to manage instead of one. ZooKeeper has its own quorum, its own failure modes, its own capacity limits.
- Scaling limits. ZooKeeper struggles with large clusters (200,000+ partitions) because it holds all metadata in memory and replicates synchronously.
- Split-brain risks. Network partitions between Kafka brokers and ZooKeeper nodes can trigger false leader elections, causing data unavailability or even data loss.
- Upgrade complexity. Rolling upgrades require coordinating both Kafka and ZooKeeper versions, doubling the maintenance window.
For years, ZooKeeper was one of the top operational complaints from Kafka administrators worldwide.
3. Scaling Is Manual and Risky
Adding brokers to a Kafka cluster doesn't automatically rebalance partitions. You have to:
- Add the new broker to the cluster.
- Generate a partition reassignment plan (using
kafka-reassign-partitions.sh). - Execute the reassignment — which moves data between brokers over the network.
- Monitor the reassignment to ensure it doesn't saturate network bandwidth or disk I/O.
- Verify that ISR (In-Sync Replica) counts are healthy after the move.
Get any of this wrong, and you risk consumer lag spikes, producer timeouts, or worse — silent data loss.
4. Configuration Drift and Debugging Nightmares
Kafka has over 400 configuration parameters across brokers, topics, producers, and consumers. Over time, configurations drift:
- One topic has
retention.msset to 7 days, another to 30 days, and nobody remembers why. - A broker's
num.io.threadswas increased during a fire drill and never reverted. - Consumer group offsets are lagging, but the root cause is a
max.poll.recordsmismatch buried three services deep.
Without a centralized configuration plane, troubleshooting Kafka becomes an archaeological expedition.
5. Monitoring and Alerting Require a Separate Stack
Kafka doesn't ship with a production-grade monitoring UI. To get visibility into your clusters, you typically need:
- JMX exporters to extract broker metrics (under-replicated partitions, request latency, log flush time).
- Prometheus to scrape and store those metrics.
- Grafana dashboards (often community-maintained, rarely up to date).
- Custom alerting rules for consumer lag, disk usage, and ISR shrinkage.
That's four tools just to see what Kafka is doing — before you even build a data pipeline.
6. The Cost Problem: Kafka Is Not Built for SME Budgets
Here's the part nobody talks about at conferences: running Kafka is expensive — and the cost hits small and medium-sized enterprises the hardest.
A minimally viable production Kafka cluster requires:
- 3 broker nodes for fault tolerance (replication factor 3). On AWS, that's 3×
m5.xlargeinstances at ~$140/month each = $420/month just for compute. - 3 ZooKeeper nodes (in legacy mode) — another 3×
t3.mediumat ~$30/month each = $90/month. - Persistent SSD storage — 500GB per broker at $0.10/GB = $150/month.
- Network transfer costs — inter-broker replication, producer/consumer traffic. At scale, this alone can reach $200-500/month.
- Monitoring stack — Prometheus, Grafana, alerting infrastructure = $50-150/month for hosted solutions.
That's $900-1,300/month minimum — before you've written a single line of pipeline code. And this is a small cluster. For production workloads with high throughput, multi-region replication, or strict compliance requirements, costs easily climb to $5,000-15,000/month.
But the real cost isn't infrastructure — it's people. A dedicated Kafka engineer commands $150,000-$200,000/year in the US market. For a 10-person startup or a 50-person mid-market company, that's an entire headcount allocated to keeping one piece of infrastructure alive.
The math doesn't work for most SMEs. So they either:
- Avoid Kafka entirely and settle for batch processing, accepting hours-old data.
- Use a managed service like Confluent Cloud or Amazon MSK — which solves some operational pain but still costs $1,000-5,000/month at moderate throughput, with per-partition and per-GB pricing that's hard to predict.
- Roll their own and accept the engineering tax — burning senior engineers on ops instead of product features.
None of these options are good. SMEs shouldn't have to choose between real-time data and financial viability.
How Dataverses Saves the Day
Dataverses takes all of this operational complexity and wraps it into a single, unified interface. Instead of managing Kafka as a standalone infrastructure project, you manage it as a native capability of your data platform — alongside ingestion, transformation, AI, and dashboards.
Here's what that looks like in practice:
Pay for What You Use — Not for Idle Brokers
Unlike self-managed Kafka or per-partition managed services, Dataverses bundles Kafka as part of the platform. You're not paying separately for broker nodes, ZooKeeper instances, monitoring tools, and engineering time. Kafka clusters share the compute infrastructure of your Dataverses workspace, with autoscaling that scales to zero during idle periods.
For SMEs, this changes the economics entirely:
| Cost Component | Self-Managed Kafka | Managed Service (Confluent/MSK) | Dataverses |
|---|---|---|---|
| Minimum monthly cost | $900-1,300 | $1,000-5,000 | Included in platform |
| Dedicated Kafka engineer | Required ($150-200K/yr) | Partially needed | Not needed |
| Monitoring stack | Separate ($50-150/mo) | Partially included | Built-in |
| Scaling cost | Manual + over-provisioned | Per-partition pricing | Autoscale to zero |
| Time to first pipeline | Days to weeks | Hours | Minutes |
You get production-grade Kafka without the production-grade bill.
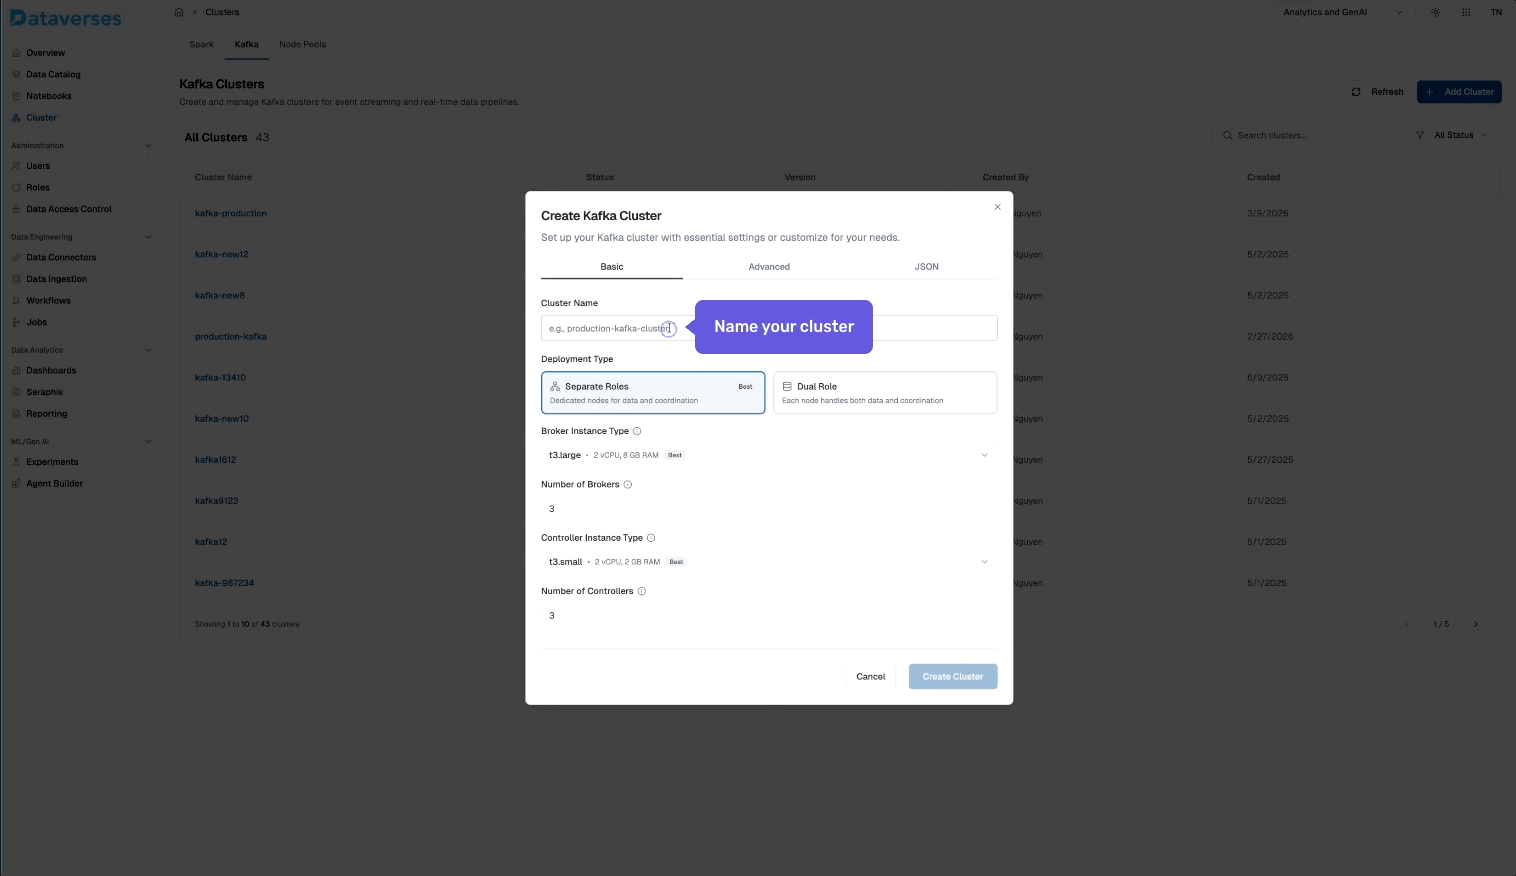
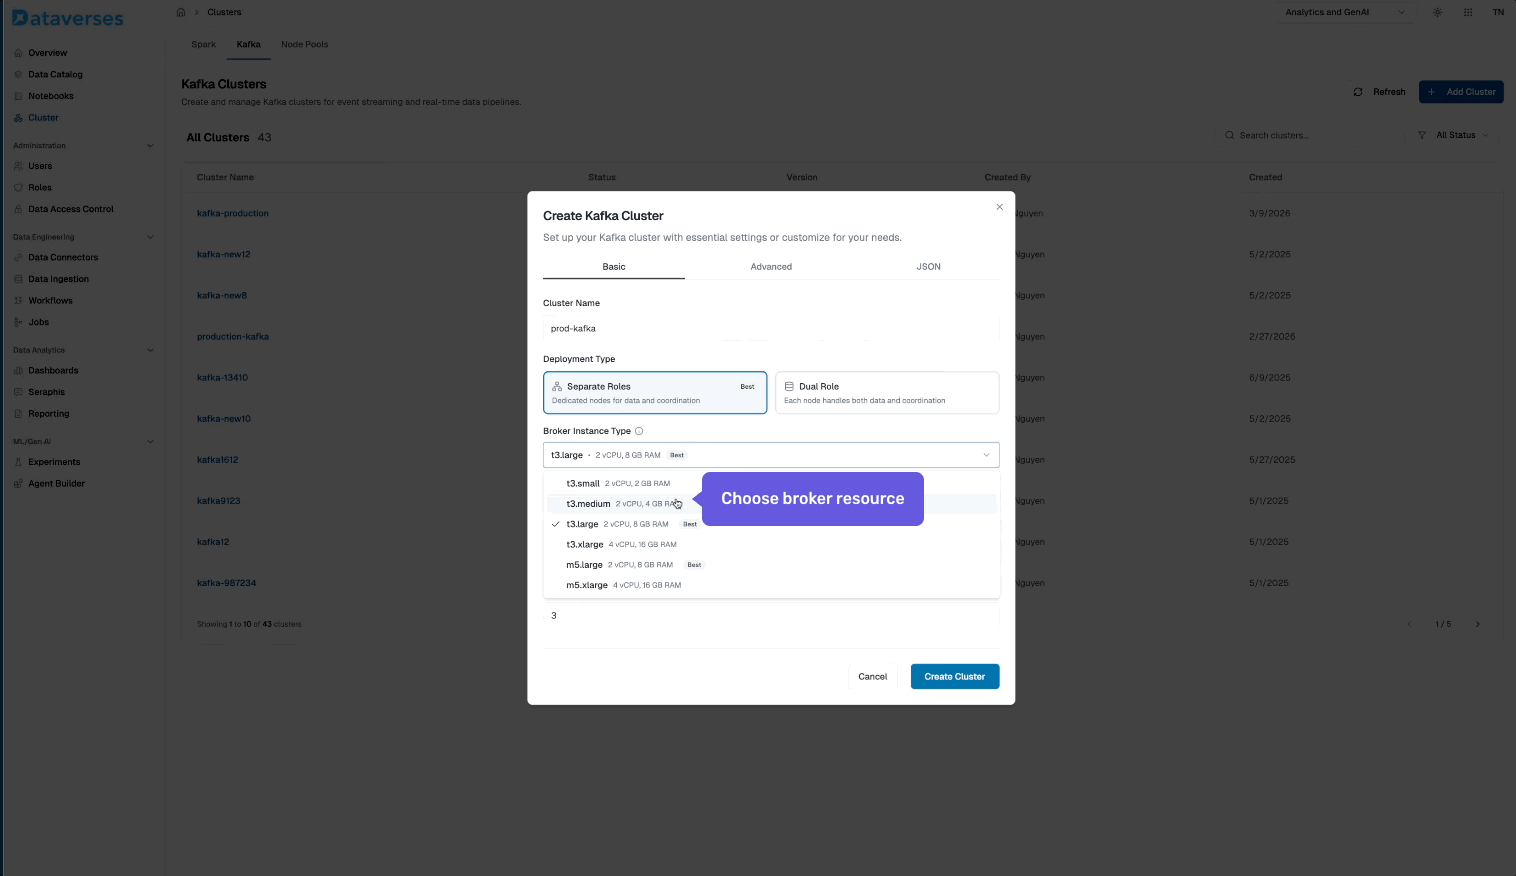
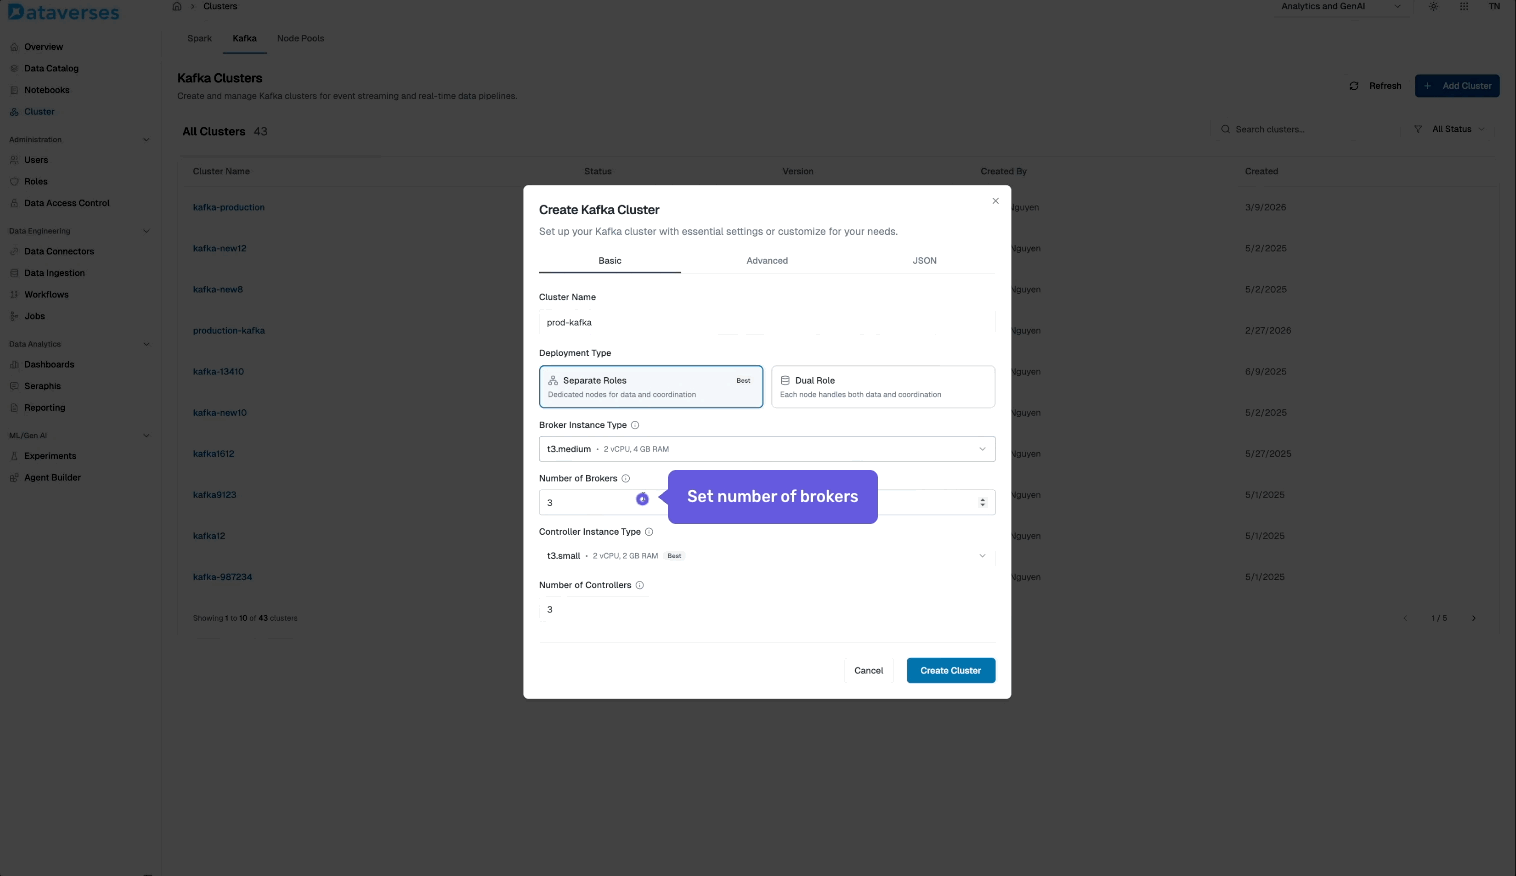
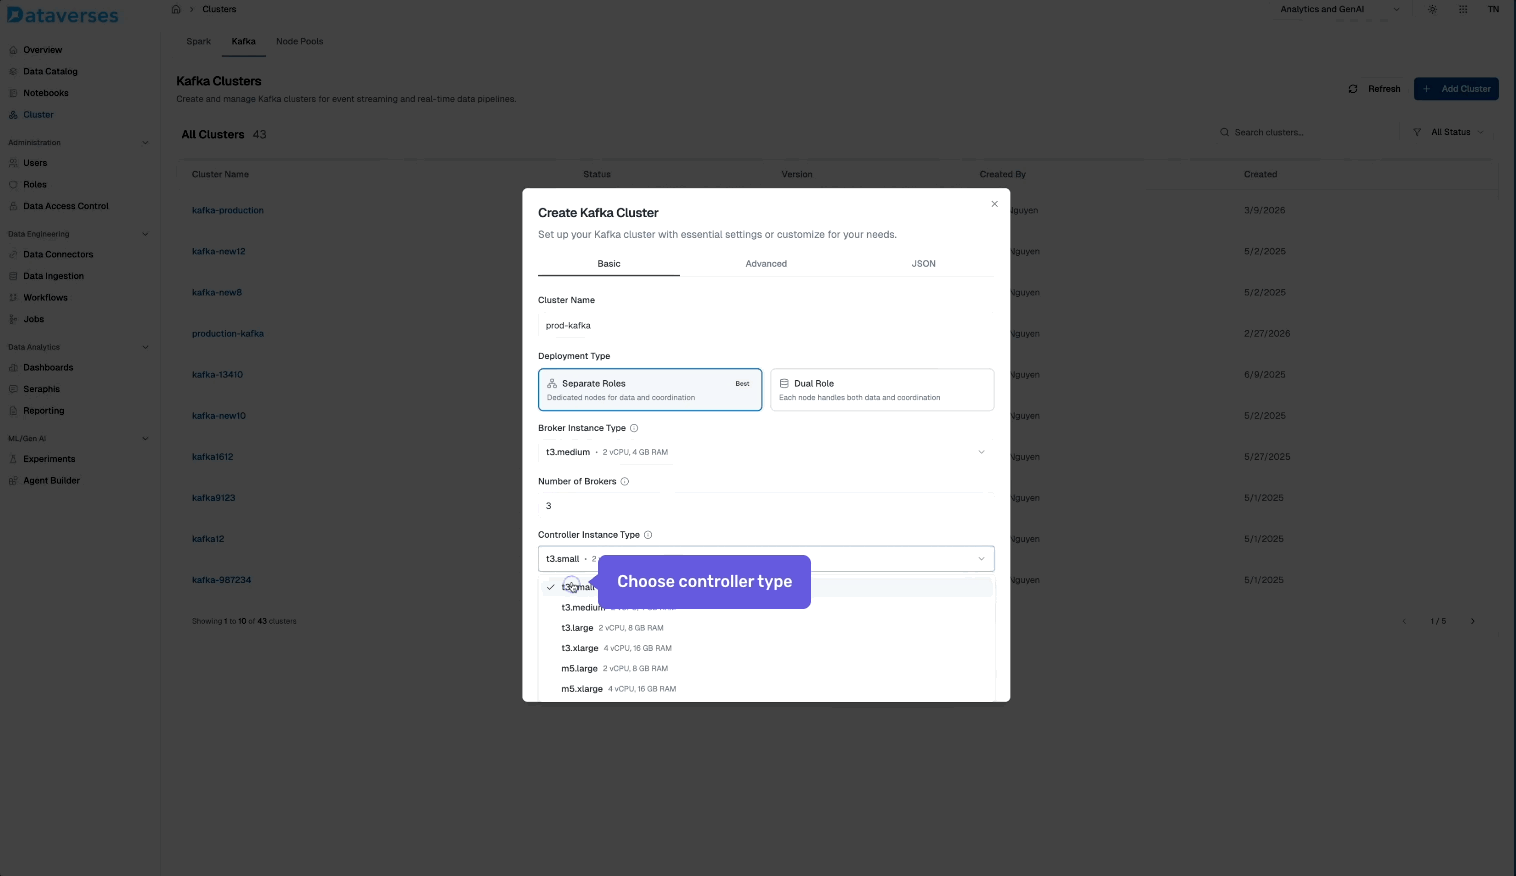
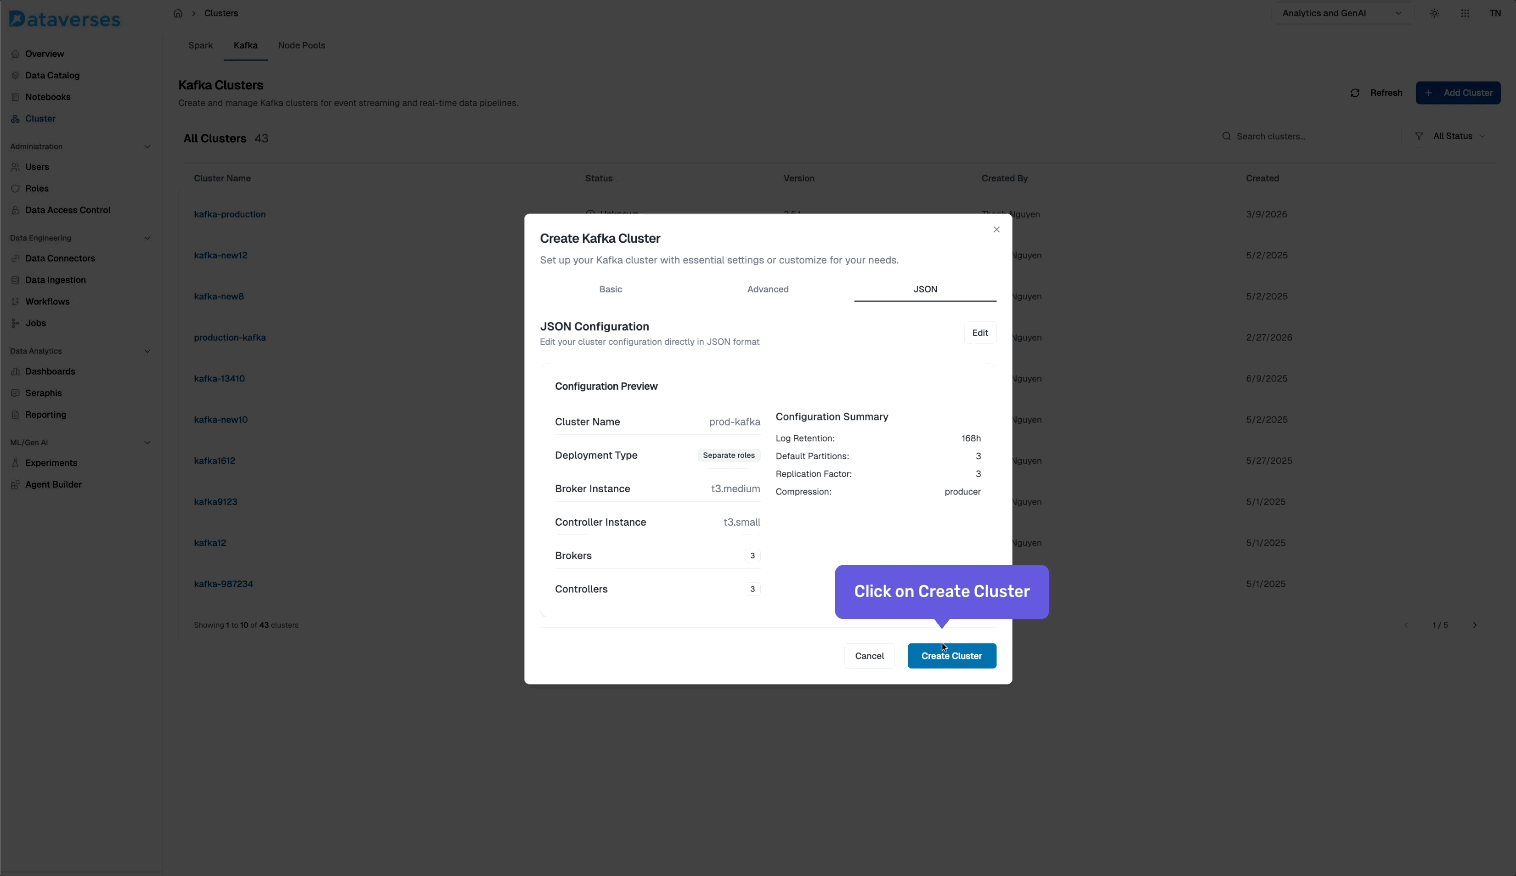
One-Click Cluster Provisioning
From the Dataverses console, navigate to Infrastructure → Kafka Clusters and click Create Cluster. You'll configure:
- Cluster name and environment tag (dev, staging, production).
- Number of brokers and instance size.
- Storage per broker — SSD-backed, with configurable retention.
- Replication factor — default 3 for production workloads.
- Network configuration — automatically provisioned within your Dataverses workspace VPC.
Hit create, and your cluster is ready in minutes — fully configured, secured, and monitored out of the box.
Visual Topic Management
No more SSH-ing into broker nodes to run kafka-topics.sh. Dataverses provides a visual topic management interface where you can:
- Create topics with custom partition counts, replication factors, and retention policies.
- View topic details — partition distribution across brokers, message throughput, consumer group assignments.
- Edit configurations in place — change
retention.ms,cleanup.policy,compression.type, ormax.message.byteswith a form, not a CLI command. - Delete topics safely with confirmation guards.
Every configuration change is audited — you can see who changed what and when, eliminating the "mystery config" problem.
Integrated Producer and Consumer Monitoring
Dataverses embeds Kafka monitoring directly into the platform dashboard. For each cluster, you get:
- Broker health — CPU, memory, disk utilization, and network I/O per broker node.
- Topic throughput — messages in/out per second, bytes in/out per second, per topic.
- Consumer group lag — real-time lag per partition, with trend lines to spot growing backlogs.
- Under-replicated partitions — instant alerts when ISR counts drop below the replication factor.
No external Prometheus, no Grafana setup. It's all there, in the same UI where you manage your data pipelines.
Autoscaling Without the Toil
Dataverses supports horizontal autoscaling for Kafka clusters. Define your scaling policy:
- Scale up when average broker CPU exceeds 70% for 5 minutes.
- Scale down when utilization drops below 30% for 15 minutes.
- Partition rebalancing is handled automatically after broker additions — no manual reassignment scripts.
This is critical for workloads with variable throughput — think e-commerce during Black Friday, or financial systems during market open/close.
Security by Default
Every Dataverses Kafka cluster ships with:
- TLS encryption in transit (broker-to-broker and client-to-broker).
- SASL/SCRAM authentication for producers and consumers.
- ACL-based authorization — control read/write access per topic, per service account.
- Network isolation — clusters are provisioned inside your workspace VPC with no public internet exposure.
You don't configure security after deployment. It's the default state.
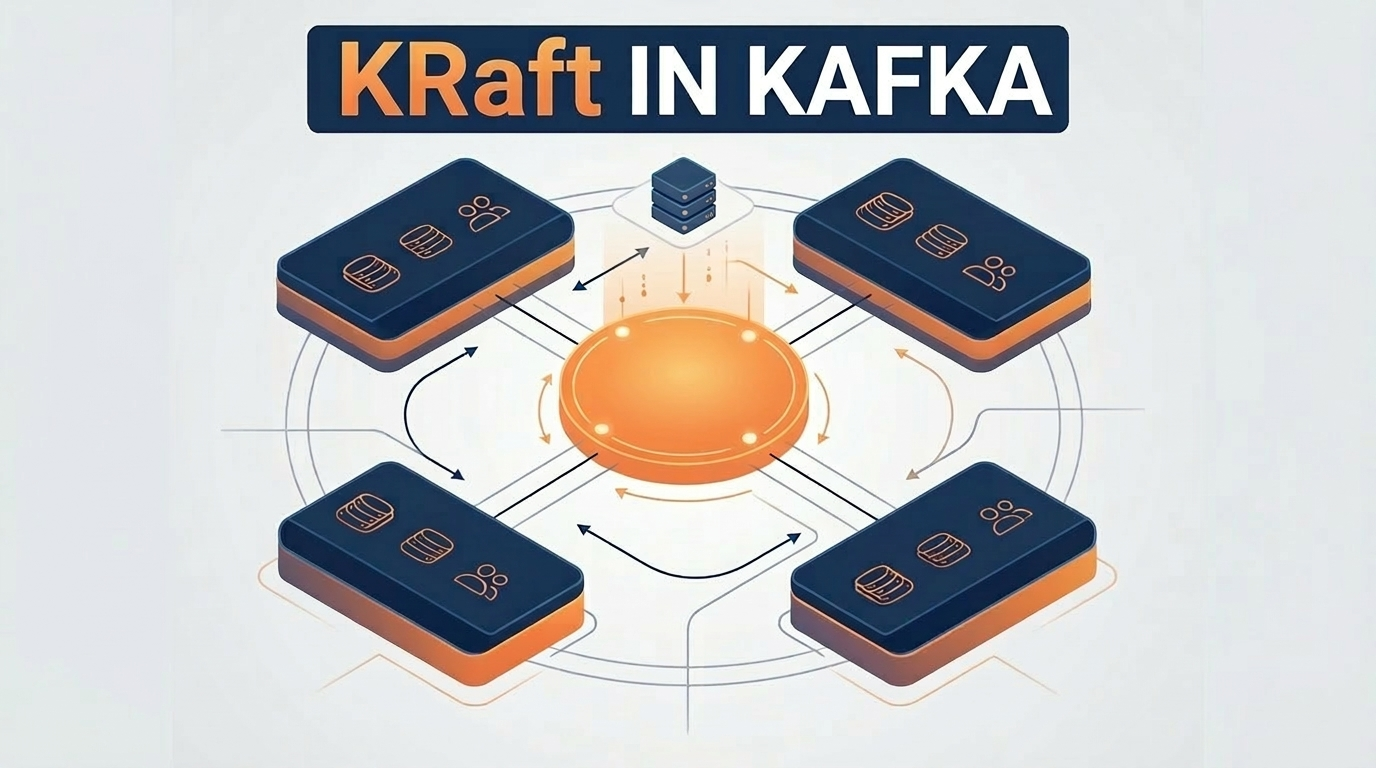
Under the Hood: KRaft Replaces ZooKeeper
One of the most important architectural decisions in Dataverses' Kafka implementation is the use of KRaft (Kafka Raft) — Kafka's built-in consensus protocol that completely eliminates the ZooKeeper dependency.
What Is KRaft?
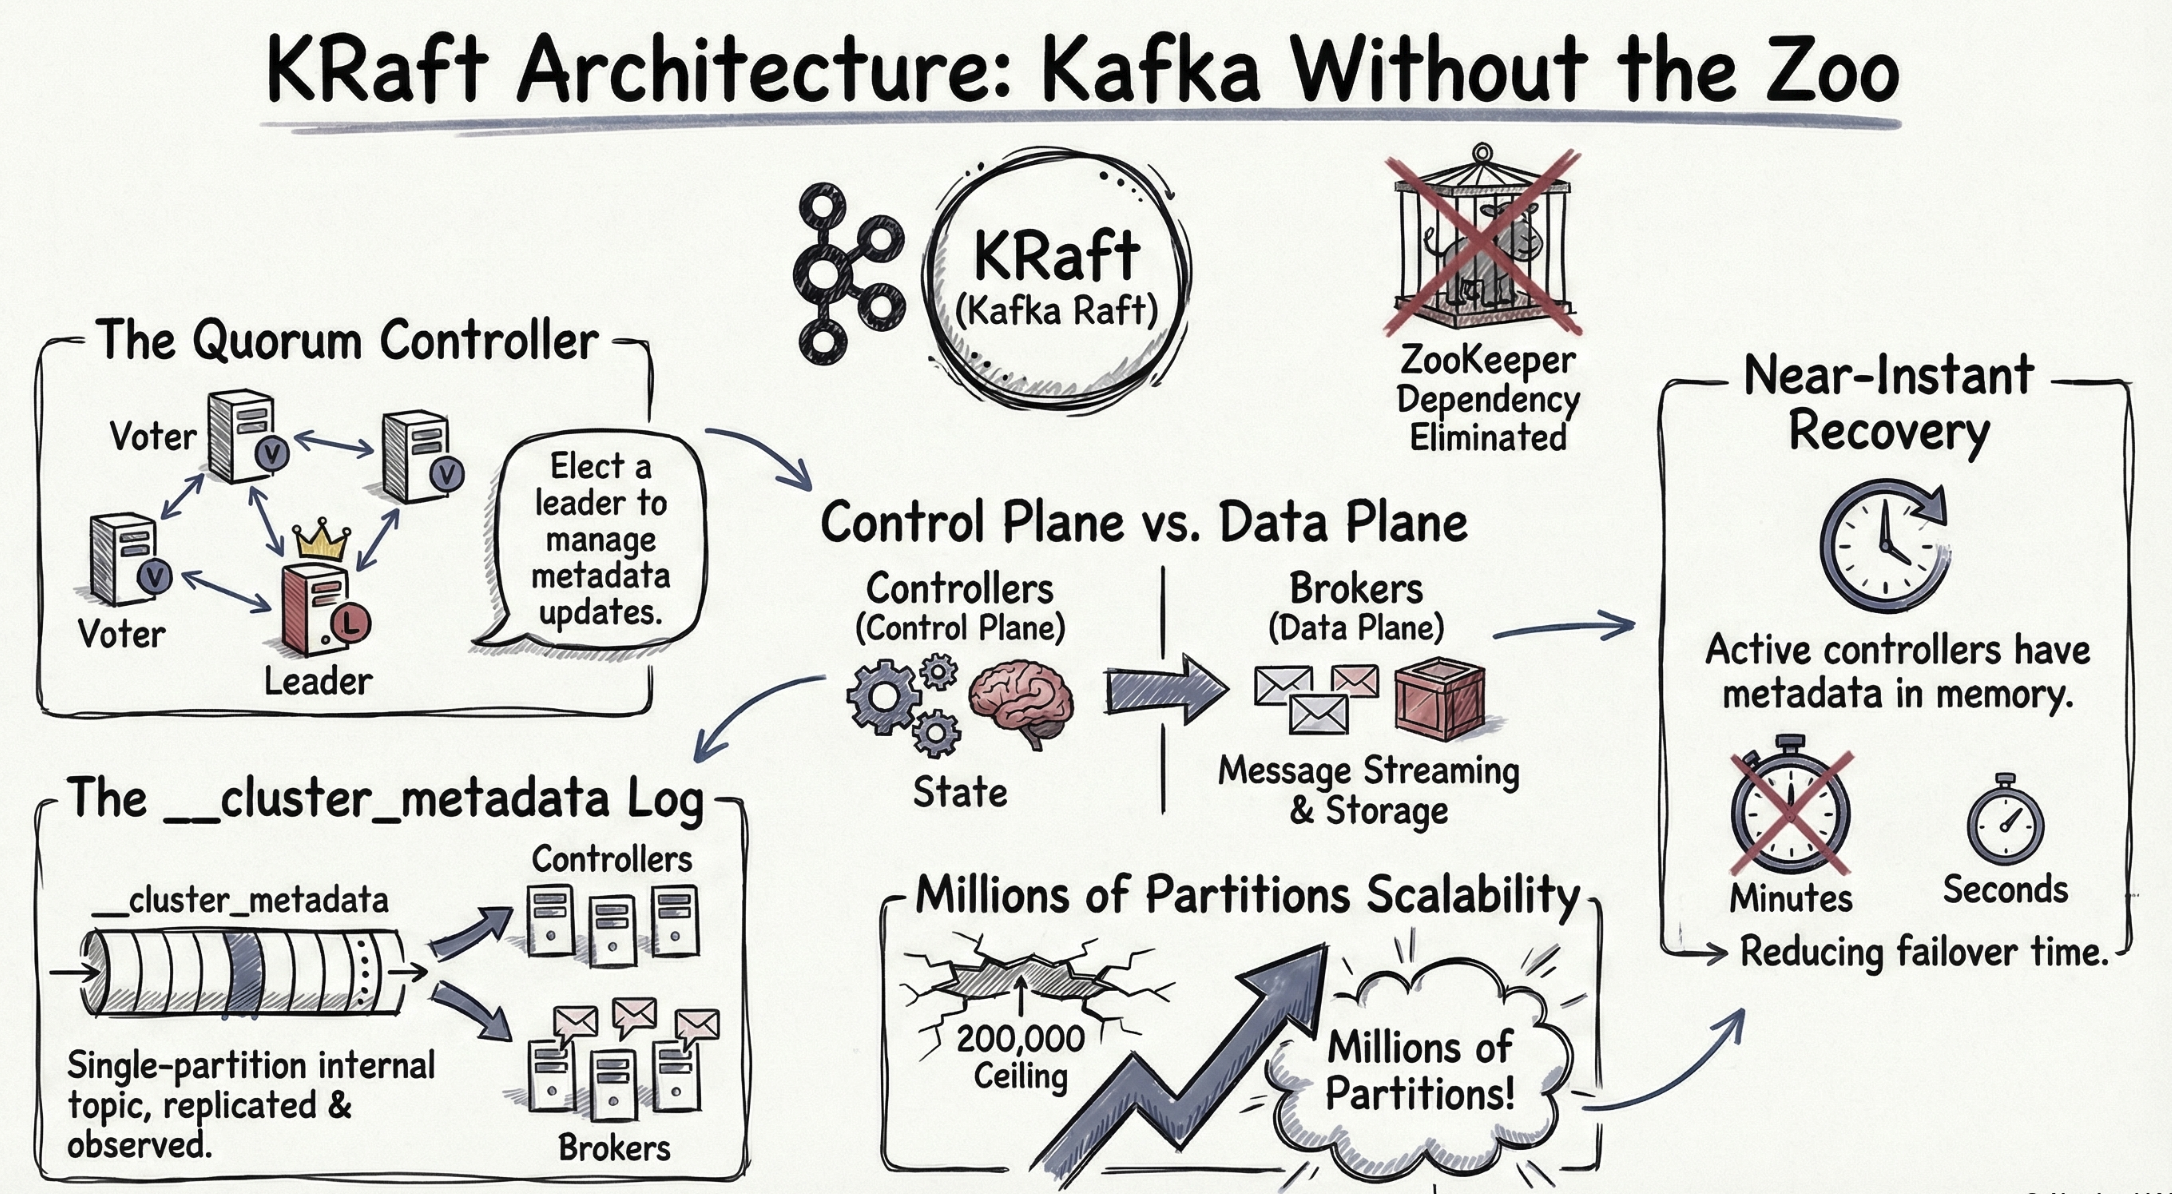
Introduced as production-ready in Kafka 3.3 (and ZooKeeper officially deprecated in Kafka 3.5), KRaft moves metadata management inside Kafka itself. Instead of relying on an external ZooKeeper ensemble, a subset of Kafka brokers are designated as controller nodes that use the Raft consensus algorithm to manage cluster metadata.
Why KRaft Matters
| Aspect | ZooKeeper Mode | KRaft Mode |
|---|---|---|
| External dependencies | Requires separate ZooKeeper ensemble (3-5 nodes) | None — metadata is managed by Kafka itself |
| Partition scalability | ~200,000 partitions before ZooKeeper becomes a bottleneck | Millions of partitions with linear scaling |
| Controller failover | 10-30 seconds (ZooKeeper session timeout + election) | Sub-second (Raft leader election) |
| Metadata propagation | Asynchronous, eventually consistent | Log-based, strongly consistent |
| Operational complexity | Two systems to monitor, upgrade, and debug | One system — simplified operations |
| Startup time | Minutes (full metadata reload from ZooKeeper) | Seconds (incremental log replay) |
How Dataverses Implements KRaft
When you create a Kafka cluster in Dataverses, the platform automatically:
- Deploys dedicated controller nodes — separated from broker nodes for isolation. In a typical production setup, 3 controller nodes handle metadata consensus while broker nodes handle data.
- Configures
process.roles— controller nodes are assignedcontrollerrole, broker nodes are assignedbrokerrole. This separation ensures metadata operations never compete with data throughput. - Generates a unique
cluster.id— each cluster gets a cryptographically unique identifier, and the metadata log is initialized usingkafka-storage.sh formatunder the hood. - Sets up controller quorum voters — the
controller.quorum.votersconfiguration is automatically populated with the controller node addresses, establishing the Raft quorum. - Enables metadata snapshots — periodic snapshots of the metadata log are taken to prevent unbounded log growth and enable fast controller startup.
You never see any of this. You click Create Cluster, and a fully KRaft-based, ZooKeeper-free Kafka cluster is ready to accept events.
The Performance Impact
KRaft isn't just an operational improvement — it delivers measurable performance gains:
- Controller failover in < 1 second vs. 10-30 seconds with ZooKeeper. In a fraud detection pipeline, that's the difference between a brief hiccup and 30 seconds of missed transactions.
- Topic creation in milliseconds vs. seconds. When your workflow dynamically creates topics for new data sources, this latency matters.
- Partition rebalancing 2-3x faster because the controller has direct, strongly-consistent access to all metadata without round-tripping through ZooKeeper.
Putting It All Together: Kafka in Your Data Pipeline
With Dataverses, Kafka isn't an isolated infrastructure component — it's a first-class building block in your data workflows. Here's how it fits into the broader platform:
1. Ingest → Stream → Transform → Serve
- Data Connectors feed change events from source databases into Kafka topics via CDC.
- Kafka buffers and distributes events with configurable partitioning for parallelism.
- Spark clusters consume from Kafka topics, run transformations (joins, aggregations, ML inference), and write results to the data lakehouse.
- Dashboards and Seraphis Agent query the lakehouse for real-time analytics and natural-language exploration.
2. Connect Kafka to Workflows
In the Workflow Builder, you can add Kafka as both a source and a sink:
- As a source — an ingestion node reads from a Kafka topic, landing raw events into your lakehouse.
- As a sink — a transformation node publishes processed results back to a Kafka topic for downstream consumers (alerts, notifications, external systems).
This bidirectional integration means Kafka isn't a silo — it's the connective tissue of your entire data platform.
3. Monitor Kafka Alongside Everything Else
Because Kafka monitoring lives in the same Dataverses dashboard as your ingestion jobs, Spark clusters, and workflow executions, you get correlated observability:
- See that consumer lag is spiking? Check if the downstream Spark job is unhealthy.
- Notice a throughput drop on a topic? Verify the upstream CDC ingestion is still running.
- Spot a broker overloaded? The autoscaler is already adding capacity.
No context-switching between tools. One platform, one view.
Getting Started
Ready to run Kafka without the operational headaches? Here's how to get started in Dataverses:
- Navigate to Cluster → Kafka Clusters in your Dataverses workspace.
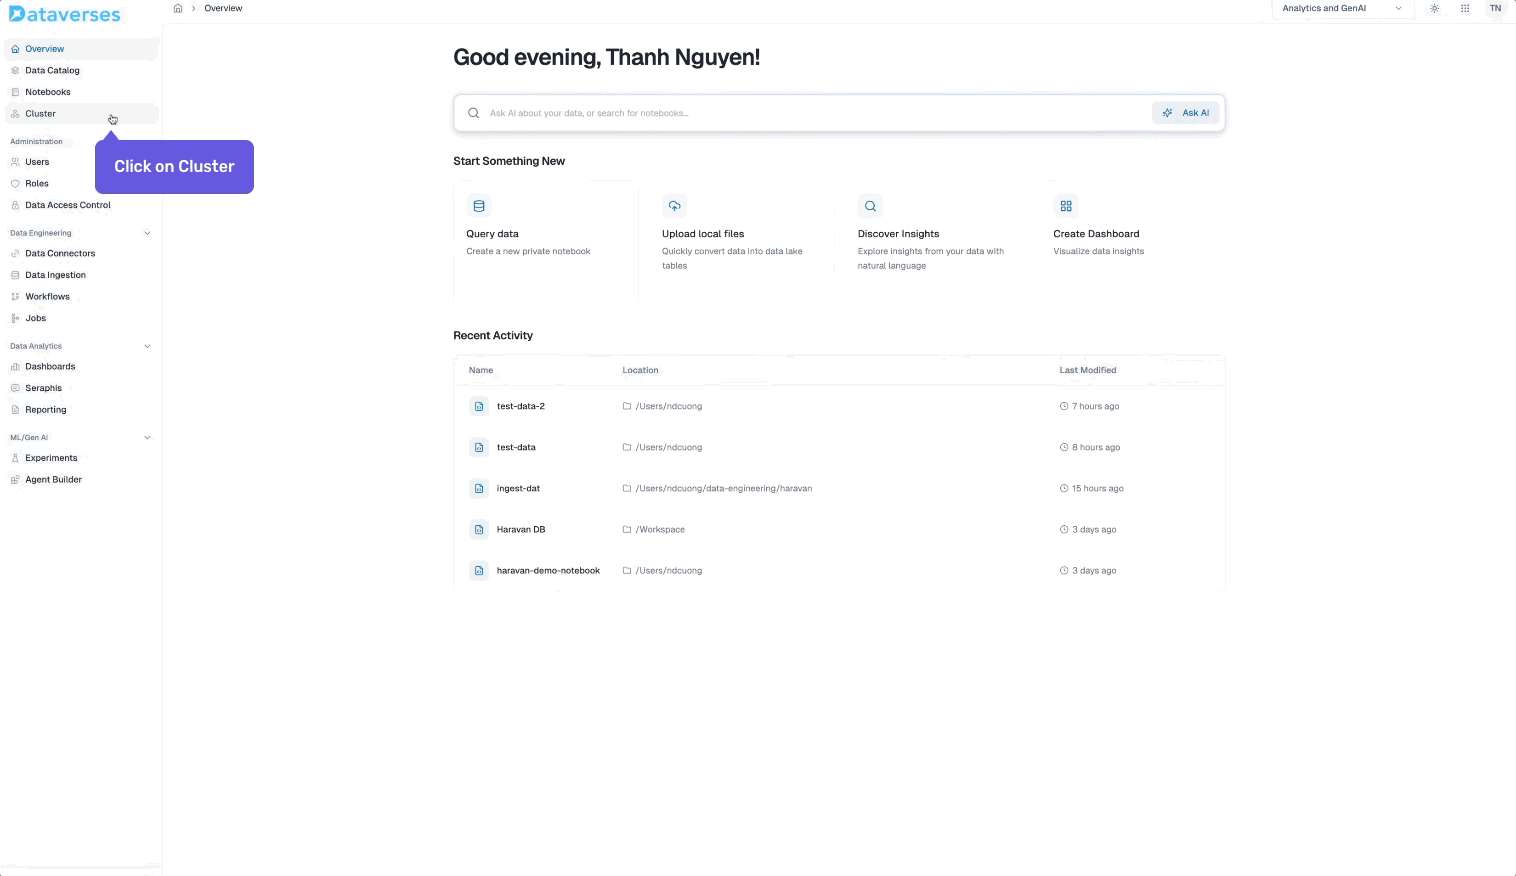
- Click Create Cluster and configure your broker count, storage, and replication.
- Create your first topic — set partitions and retention to match your use case.
- Connect a data pipeline — use Data Connectors to stream CDC events into your Kafka topic.
- Build a workflow — add Kafka as a source in the Workflow Builder and chain it with Spark transformations.
From provisioning to production pipeline — all within one platform, zero external tools required.
Your data is already moving. Now let it move in real time.
Tags
Keep up with us
Get the latest updates on data engineering and AI delivered to your inbox.
Contents in this story
Recommended for you
CDC and SCD on Apache Iceberg: Patterns, Tradeoffs, and Getting It Right
Mar 24, 2026 · 11 min read
Top 5 Data Engineering Trends to Watch in 2026
Mar 24, 2026 · 6 min read
Optimizing Apache Iceberg on S3: Avoiding Costly Infrastructure Pitfalls
Mar 24, 2026 · 8 min read