Build Powerful
Dashboards
Create interactive, SQL-powered dashboards with real-time visualizations, customizable widgets, and seamless data exploration. Share insights across your organization.
Dashboard Features
Everything you need to build, customize, and share data dashboards that drive decisions
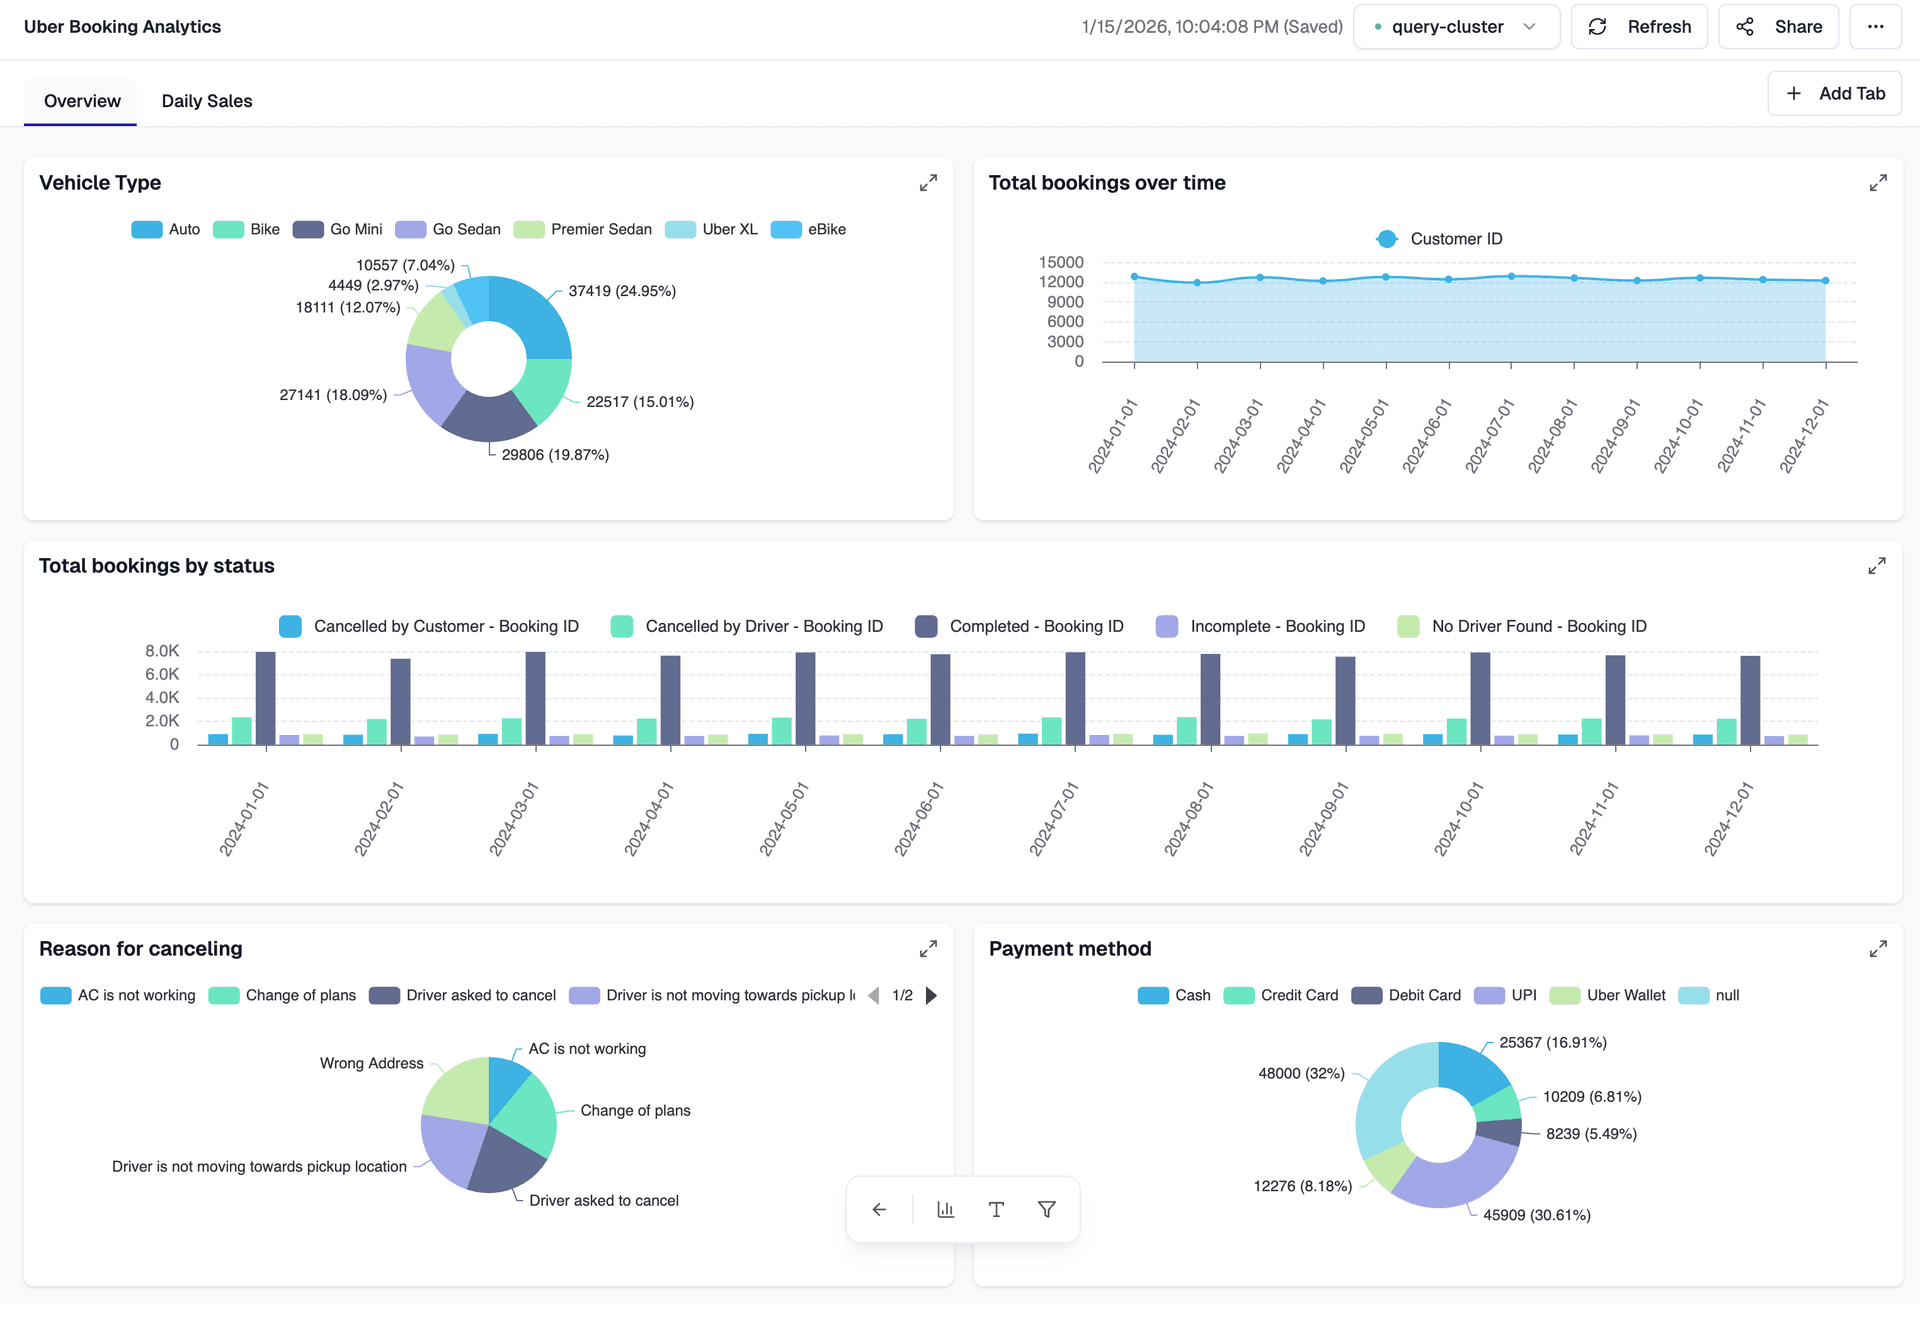
Advanced Visualizations
Choose from 20+ chart types including bar charts, line charts, pie charts, scatter plots, heatmaps, and custom visualizations.
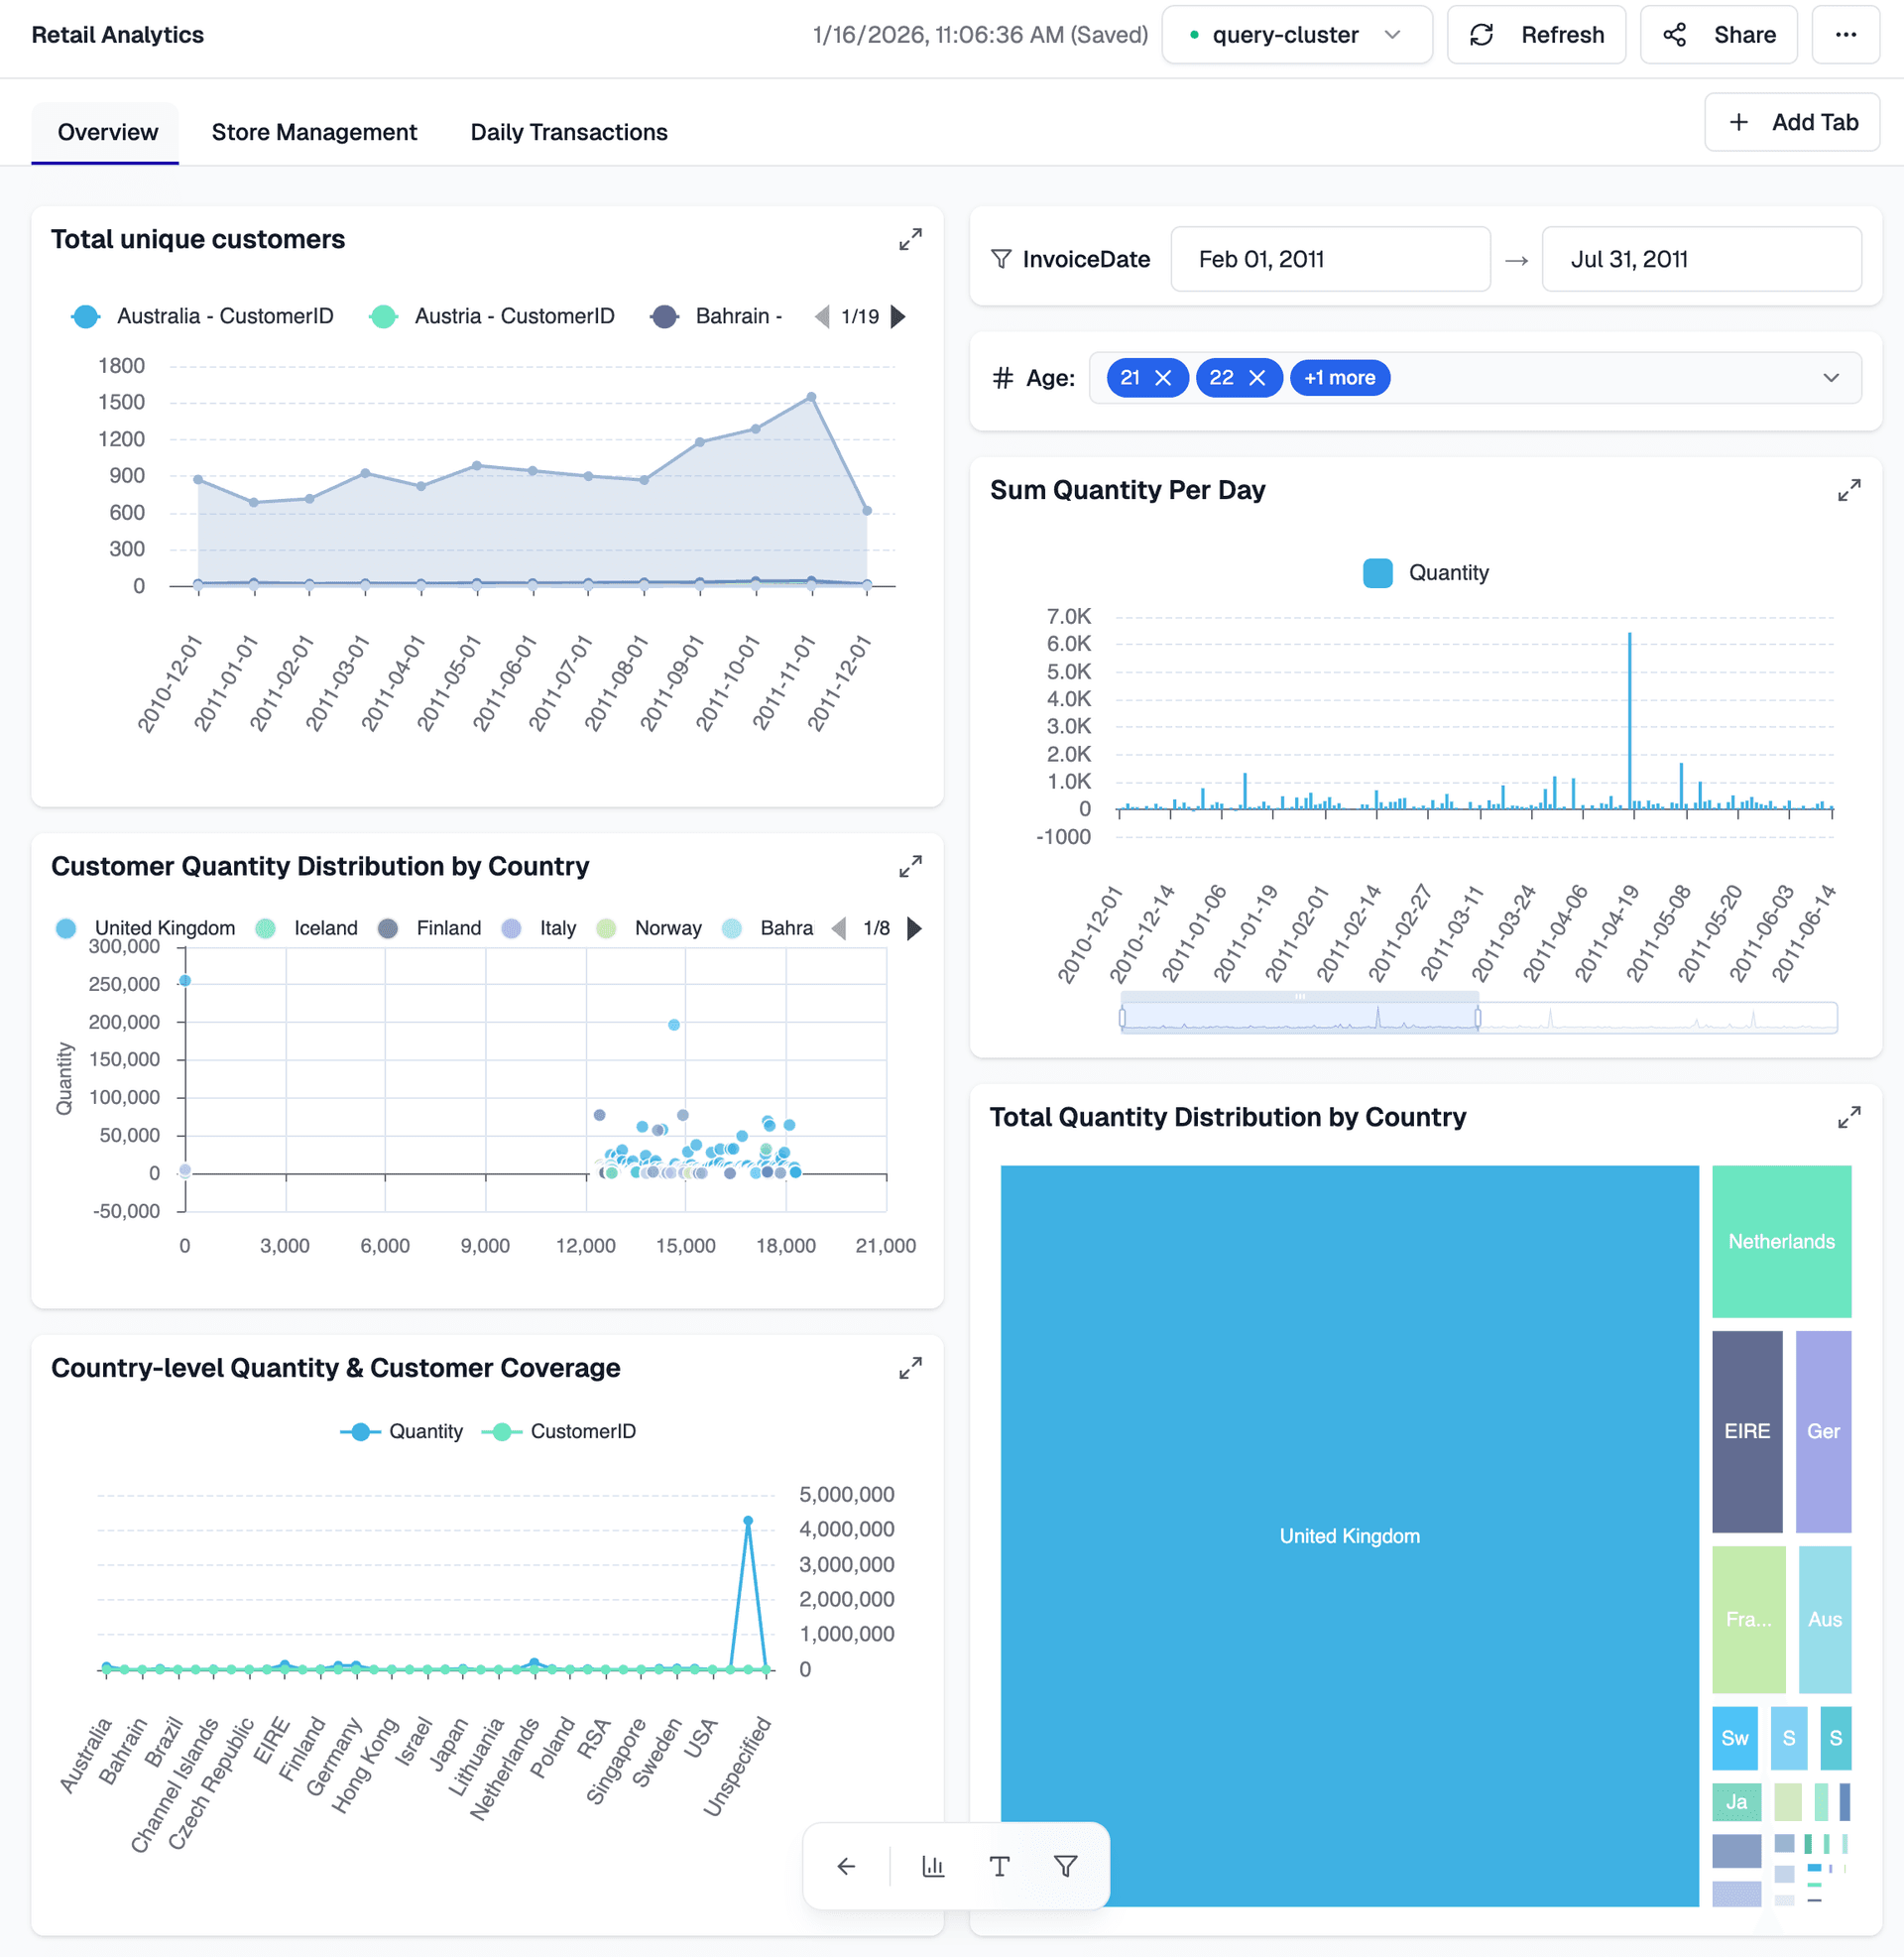
Dynamic Filtering
Collaboration & Sharing
Customizable Layouts
Dashboard Use Cases
From business intelligence to data science, dashboards power insights across every industry.
- •Revenue dashboards
- •Sales performance tracking
- •Customer acquisition metrics
- •Operational efficiency reports
- •Product sales dashboards
- •Customer journey analytics
- •Marketing campaign performance
- •Inventory management views
- •Customer segmentation
- •Churn analysis
- •Customer satisfaction tracking
- •Support ticket analytics
- •System health dashboards
- •Application performance monitoring
- •Infrastructure metrics
- •Alert and incident tracking
- •Financial performance dashboards
- •Budget tracking
- •Expense analysis
- •Compliance reporting
- •Model performance dashboards
- •Experiment tracking
- •Feature importance analysis
- •Data quality monitoring
Related Resources
Learn how to build powerful dashboards with our comprehensive guides, tutorials, and real-world examples.
Announcing Apache Spark 4.2.0: Geospatial Intelligence, First-Class CDC, DSv2 Transactions, and Arrow-Powered PySpark
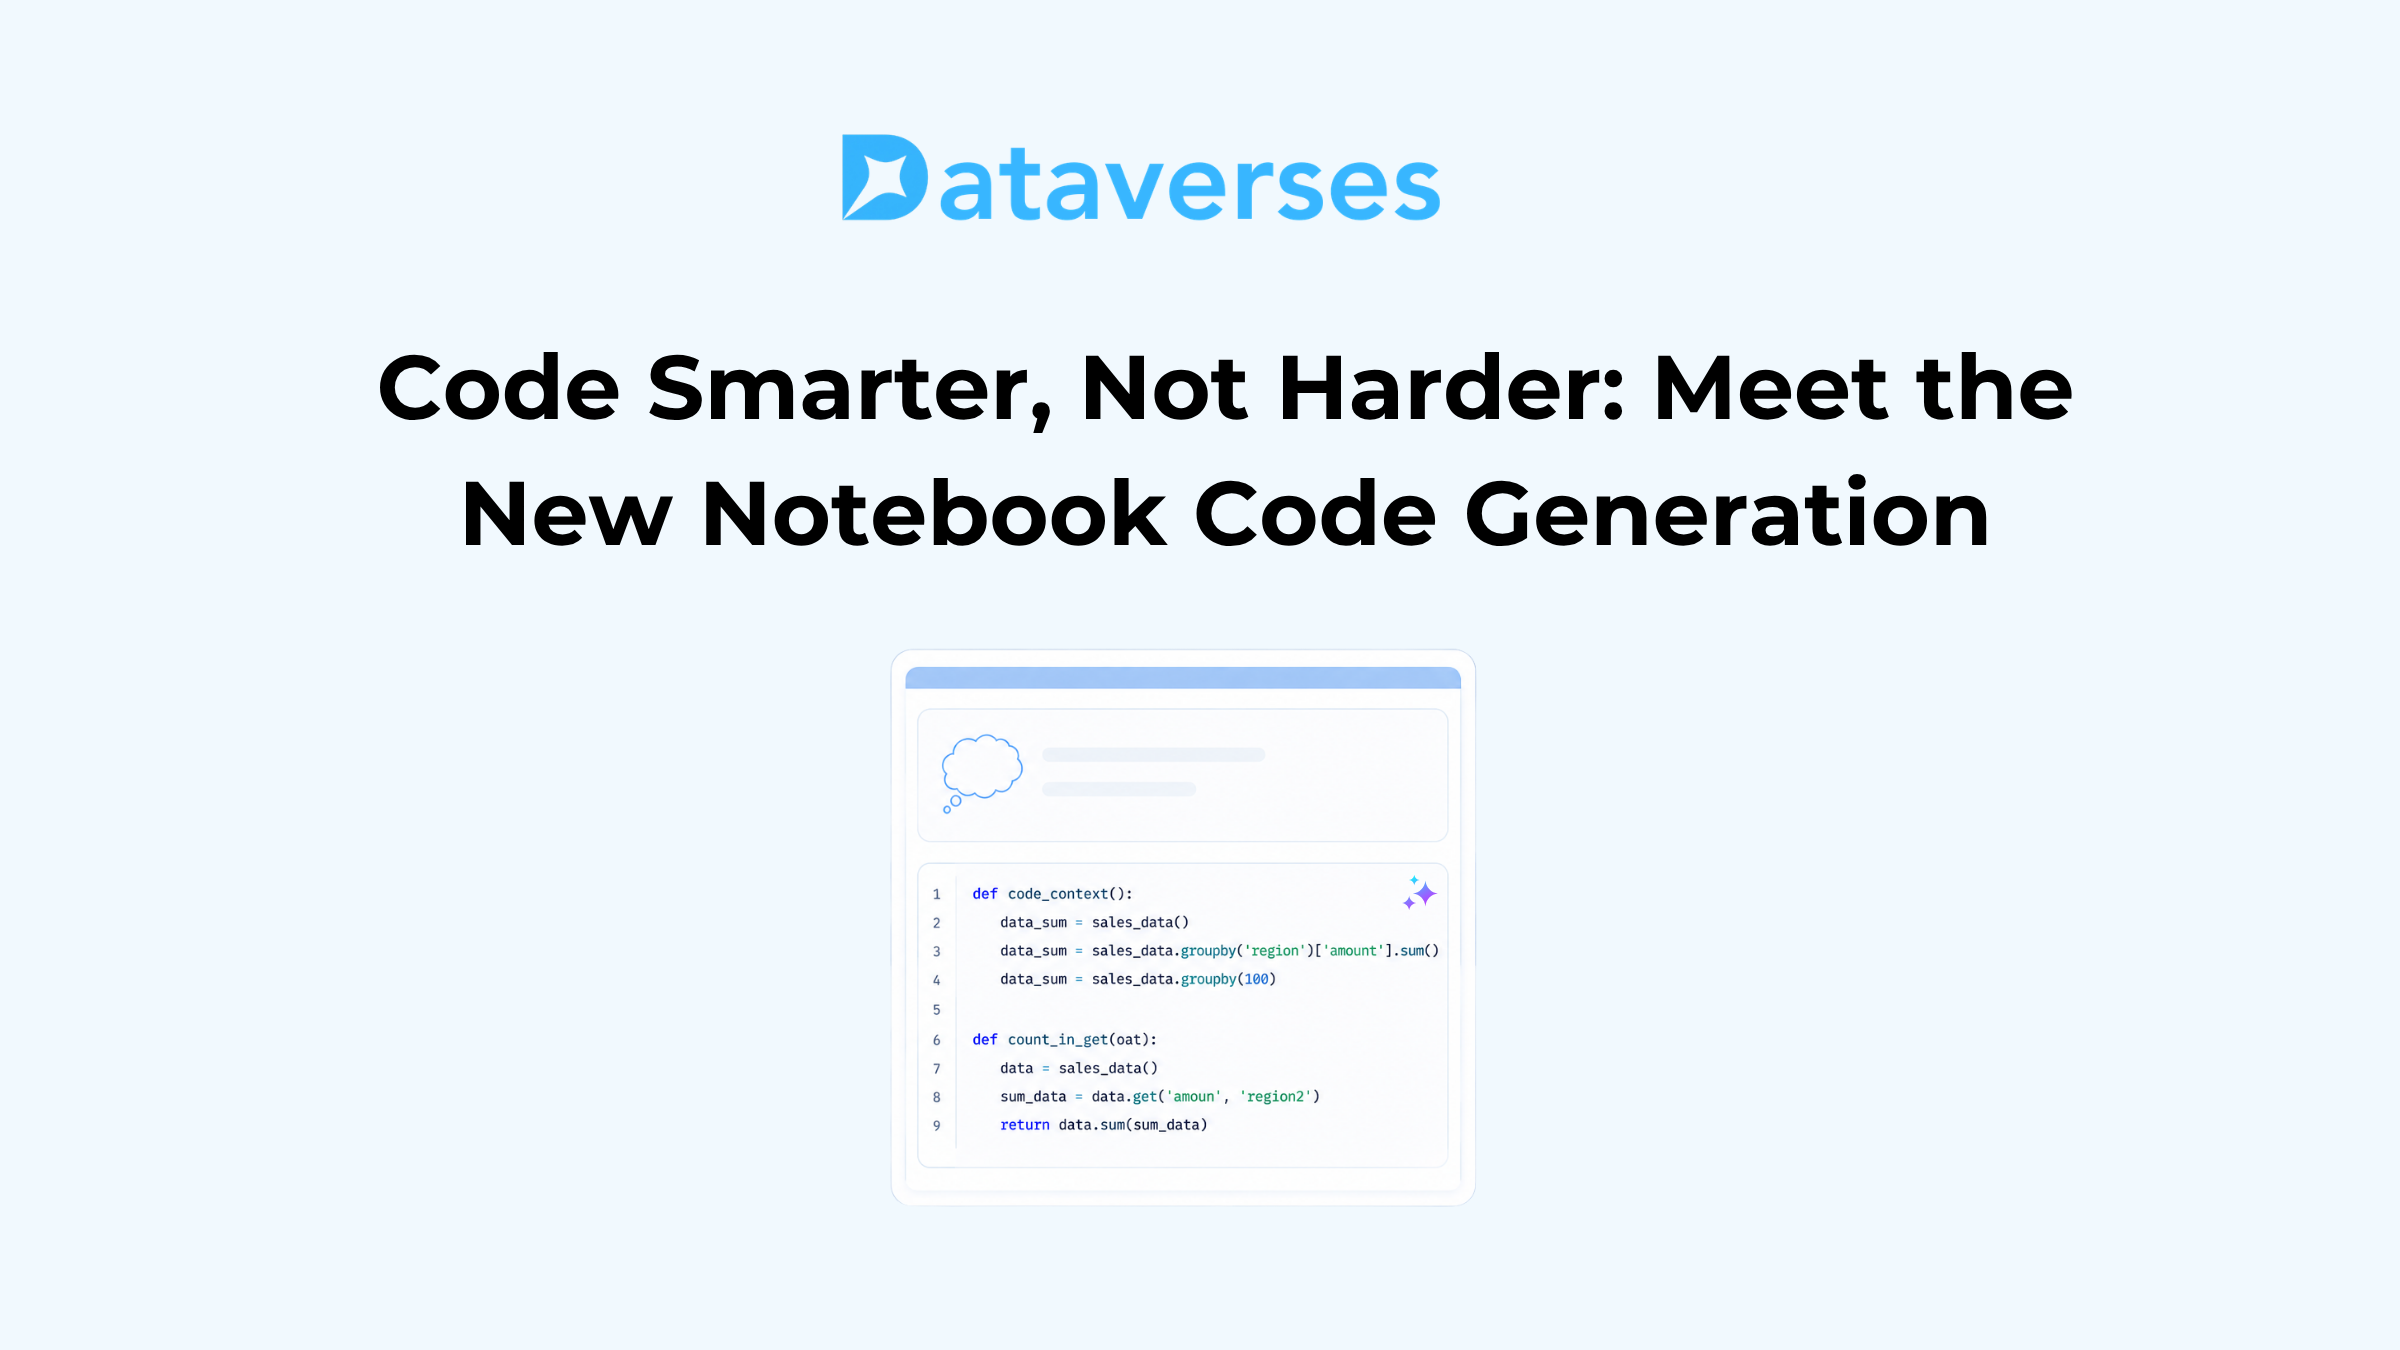
Code Smarter, Not Harder: Meet the New Notebook Code Generation on Dataverses
Apache Iceberg 1.11.0 Release: Deletion Vectors, Variant Type, and V3 Maturity
Spark Declarative Pipelines in Apache Spark 4.1: A Complete Guide
Frequently Asked Questions
Everything you need to know about Dataverses Dashboard
Dataverses Dashboard is an interactive SQL-powered dashboard platform that lets you create, customize, and share data visualizations. You define datasets using SQL queries, add visualizations like charts and tables, apply filters, and share dashboards with your team. It's similar to Databricks SQL dashboards with support for real-time data, interactive widgets, and collaboration features.
Dataverses Dashboard connects to a wide range of data sources including databases (PostgreSQL, MySQL, SQL Server), data warehouses (Snowflake, BigQuery, Redshift), data lakes (S3, Azure Data Lake, GCS), and streaming platforms (Kafka). You can also connect to APIs and cloud services through our connectors.
Our dashboard platform supports 20+ visualization types including bar charts, line charts, pie charts, scatter plots, heatmaps, tables, gauges, funnels, and custom visualizations. All charts are interactive with drill-down capabilities, hover tooltips, and responsive design that works on any device.
Creating a dataset is simple! Navigate to the Data tab in your dashboard, click 'Create from SQL', and enter your SQL query. You can write complex queries with joins, aggregations, window functions, and CTEs. Use parameters (like $date_range) to make queries dynamic and reusable across multiple visualizations.
Yes! You can add various types of interactive filters including dropdown menus, date range pickers, text inputs, multi-select options, and numeric sliders. Filters automatically update all related visualizations in the dashboard, allowing users to explore data without writing SQL queries.
You can share dashboards by publishing them and setting access permissions. Share with specific users, teams, or make them public. Collaborators can view, comment, and in some cases edit dashboards. You can also embed dashboards in other applications or export them as PDFs or images.
Absolutely! You can set automatic refresh intervals (every minute, hour, day, etc.) or configure dashboards to refresh when underlying data changes. You can also schedule dashboard updates and receive notifications when data is refreshed or when specific metrics cross thresholds.
Our dashboard platform offers extensive customization options. You can choose from pre-built themes, customize colors and fonts to match your brand, adjust widget sizes and positions with drag-and-drop, and create dashboard templates. Maintain consistency across your organization with shared themes and templates.
Yes! Parameters make your SQL queries dynamic and reusable. Use syntax like $parameter_name in your queries, and users can input values through filter widgets. For example, use $start_date and $end_date for date ranges, or $category for filtering by product categories. Parameters work across all visualization types.
Getting started is easy! First, connect a data source, then create a new dashboard. Add a dataset by writing a SQL query, create visualizations by selecting chart types, add filters for interactivity, and arrange widgets in your preferred layout. We provide templates, sample dashboards, and comprehensive documentation to help you get started quickly.
Ready to Transform Your Data Pipeline?
Start building streaming data applications today. Get up and running in minutes with our cloud platform or deploy on-premises.
No credit card required • 14-day free trial • Cancel anytime